Do Audio Features Drive Song Popularity?
The Goal
This analysis explored a deceptively simple question: Do audio features predict track popularity on Spotify? I hypothesized that technical characteristics like energy, danceability, valence, tempo, and loudness would correlate strongly with popularity scores. Using SQL aggregation, statistical correlation analysis, and visualization, I tested whether the data supported this intuition or challenged it.
The Data
The dataset contains 114,000 Spotify tracks with 21 engineered features and metadata. Key variables included:
This rich feature set provided ample opportunity to investigate relationships between sonic characteristics and commercial success.
The Approach
1. SQL Aggregation
I started with foundational data exploration using SQLite to understand the distribution and central tendencies of key audio features. This step answered basic questions: What is the typical energy level across all tracks? How fast are songs on average? These aggregations set the stage for deeper analysis.
Key Averages Computed:
SELECT
  ROUND(AVG(energy), 2) AS avg_energy,
  ROUND(AVG(danceability), 2) AS avg_danceability,
  ROUND(AVG(valence), 2) AS avg_valence,
  ROUND(AVG(tempo), 2) AS avg_tempo,
  ROUND(AVG(loudness), 2) AS avg_loudness,
  ROUND(AVG(popularity), 2) AS avg_popularity
FROM spotify_tracks
WHERE popularity > 0;
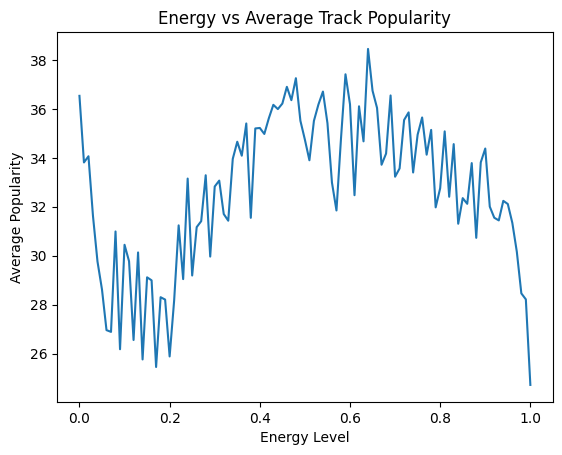
2. Energy vs Popularity (Visual Intuition)
Initial plotting suggested a promising relationship: energy and popularity appeared to move together. However, this visualization masked a critical flaw: the data points were unordered, and a line plot connecting them created an illusion of trend that didn't actually exist.
This highlighted an important lesson: visualization can mislead if not carefully designed. A scatter plot with a regression line would later tell the true story.
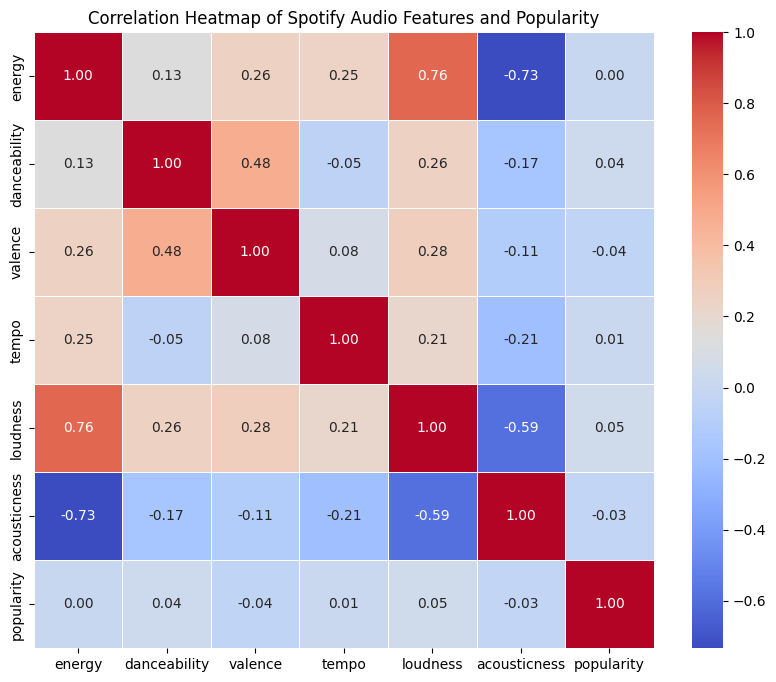
3. Correlation Heatmap: The Real Test
To rigorously test my hypothesis, I computed Pearson correlations between all audio features and popularity. The results were striking: nearly all correlations were exceptionally weak.
Loudness showed r = 0.05, danceability r = 0.04. These values suggest virtually no linear relationship. Even features like valence and energy, which I'd expected to show stronger signals, were practically uncorrelated with popularity.
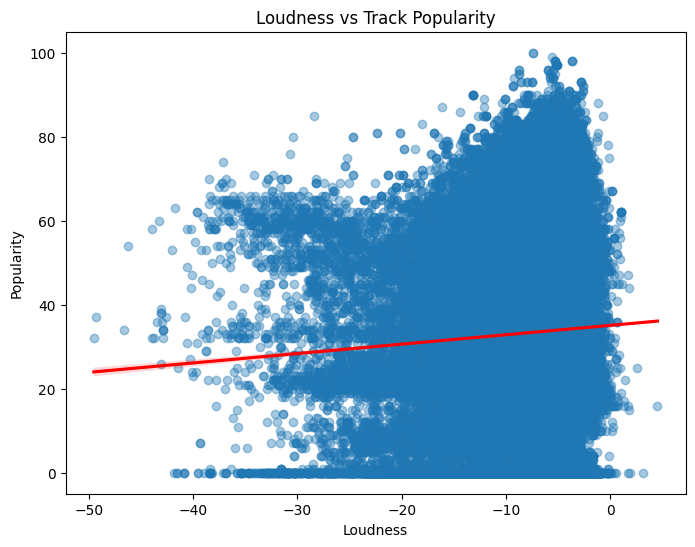
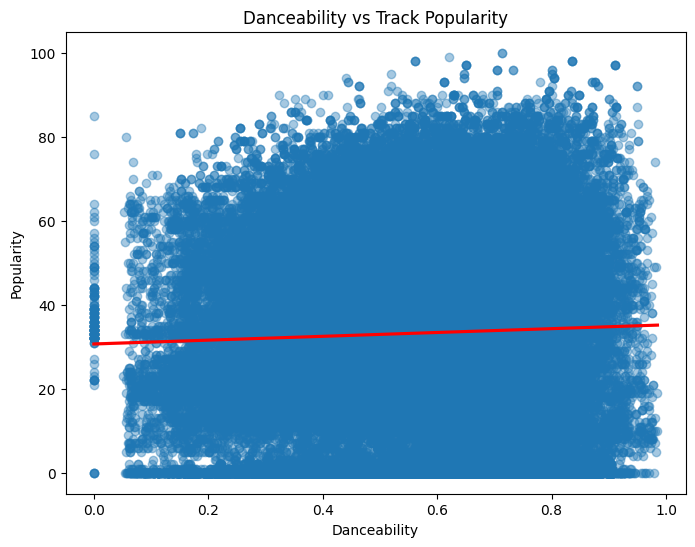
4. Scatter Plot Drill-Down
To confirm the heatmap findings, I generated scatter plots for loudness and danceability with overlaid regression lines. Both plots revealed near-horizontal trend lines, definitive evidence that audio features do not meaningfully predict popularity.
The scatter clouds were dense and unstructured, indicating high variance unexplained by these audio features. This reinforced the null finding and ruled out non-obvious patterns that correlation alone might miss.
Key Findings
The analysis conclusively demonstrated that audio features alone have virtually no predictive power for track popularity. This null result, while initially surprising, is scientifically valuable and reveals deeper truths about how Spotify tracks gain traction.
The Null Finding is the Finding
In data science and statistics, discovering that a hypothesis is wrong is just as important as confirming it, sometimes more so. This analysis disproved the intuitive assumption that audio characteristics drive popularity. Rather than dismissing the result, I recognized it as a critical insight: technical song features are not the primary lever for popularity. This redirects attention toward the actual drivers: marketing spend, playlist placement, artist reputation, release timing, and algorithmic promotion. By reporting honestly that no correlation exists, I demonstrated intellectual honesty, statistical rigor, and the value of testing assumptions against data.
What I'd Do Next
This null result opens doors to more sophisticated analyses: