The Goal
Understand where users drop off in the e-commerce funnel and build a predictive model to identify sessions likely to convert. By analyzing the customer journey from initial product view through cart abandonment to purchase, we aimed to uncover bottlenecks and develop actionable insights to improve conversion rates and reduce friction in the purchasing process.
The Data
Two complementary datasets provided a comprehensive view of customer behavior:
Retail Transactions
- 525K+ transaction records
- Invoice data with quantities & prices
- Customer IDs for traceability
- Geographic distribution (countries)
- Time-indexed for temporal analysis
E-Commerce Event Logs
- 1M+ event records (Oct-Nov 2019)
- Event types: views, carts, purchases
- Session-level granularity
- User action sequences
- Timestamps for behavior tracking
Data Preparation: Cleaned for duplicates, removed negative values, resolved type inconsistencies, and aligned schemas across datasets to ensure consistency and reliability throughout the analysis pipeline.
The Analysis
Funnel Analysis
Our initial analysis revealed a critical data quality issue that required methodological correction. The naive count of events showed impossible conversion rates, which led us to implement sequential funnel logic.
The first attempt used simple event counts, which produced a cart-to-purchase rate exceeding 100%, clearly impossible. This occurred because multiple purchase events could be attributed to the same session, and cart events weren't necessarily sequential predictors of purchases.
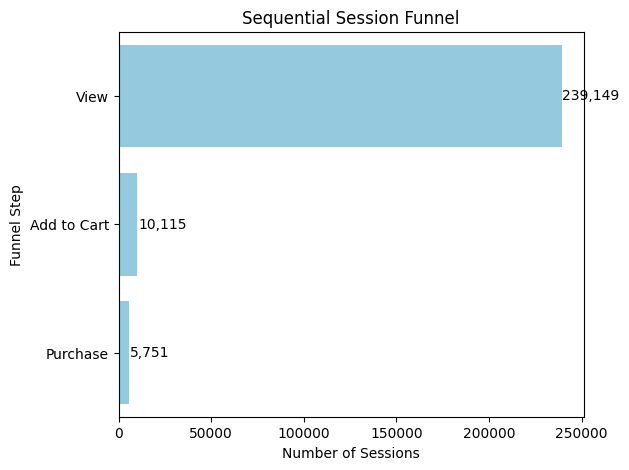
We corrected this by enforcing strict sequential funnel logic: each user session must follow the progression view → cart → purchase. This approach eliminated inflated conversion metrics and revealed the true customer journey:
These metrics reveal significant drop-off points. The funnel analysis exposed that 95% of users never add items to cart, and of those who do, only 57% proceed to purchase. The visualizations below illustrate these critical conversion transitions:
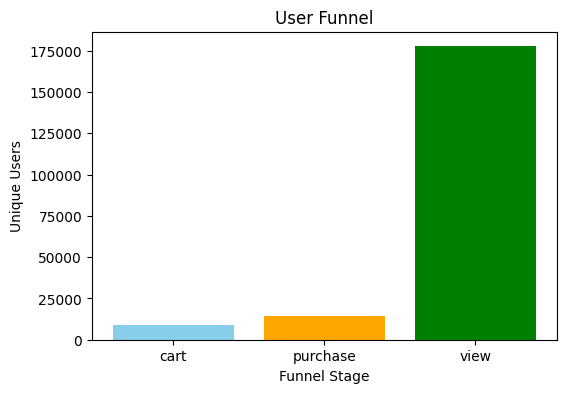
Funnel Stage Progression: Tracking user movement through browse, cart, and purchase stages
Drop-off Analysis: Percentage of users progressing through each funnel stage
Predictive Model
To move beyond descriptive analytics, we built a logistic regression model to predict which sessions would result in a purchase based on observed behavior patterns.
The model uses three key session-level features:
- Number of views: Quantity of products browsed in a session
- Number of cart actions: Items added to cart (strongest signal)
- Session length: Duration of user engagement
Model Performance Metrics:
The model achieves 93% accuracy with a 0.76 AUC, indicating strong discriminative power. The logistic regression coefficients reveal the relative importance of each feature:
Key Findings
Business Recommendations
Based on the analysis, we recommend prioritizing initiatives that address the largest friction points:
- Cart Recovery Interventions Since 57% of cart sessions convert to purchases, capturing the remaining 43% via email reminders, incentives, or retargeting could yield significant revenue gains with minimal product changes.
- Optimize Product Pages The 95% browse-to-cart drop-off suggests friction in the product discovery and decision process. A/B test page layouts, product information, and recommendations to reduce abandonment.
- Personalize High-Intent Sessions Use the predictive model to identify high-likelihood converters in real-time and deliver personalized offers, reviews, or urgency messaging to accelerate purchase.
- Monitor Funnel Metrics Weekly Establish dashboards tracking view-to-cart and cart-to-purchase conversion rates. Early detection of changes enables rapid intervention before revenue impact compounds.
What I'd Do Next
This analysis provides a strong foundation, but several extensions would deepen insights and improve actionability: